Quick Market

Quick Market
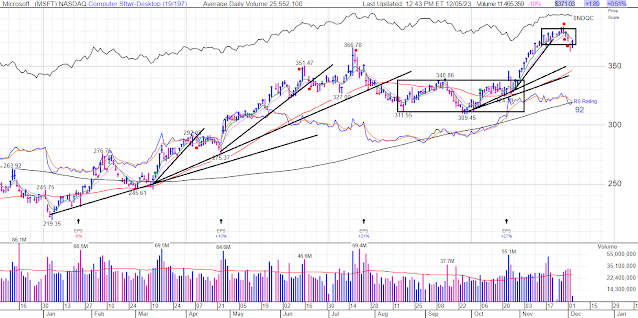
(6 month view)
When looking at the big picture it is first helpful to identify trends and ranges, then to get a sense of where the extremes and outliers are, and finally to compare and contrast current price action vs. prior action for context (example depth or duration of pullbacks).
Whatever big picture charts you use it is important that you know why you've chosen what you've chosen. What does it address? What question does it ask and answer? In this example, I compare the indices to $NYA 50 and 200. It can reveal if most stocks are participating or if it's mostly big caps. You could just as easily use an equal weighted index, but I find this much more useful . I use $Namo, $Nysi, $Vix and $CPC to identify extremes. I use $Tran, $Sox, $Usd, and $Wtic to identify general head and tailwinds for the market.
Only you can decide what will work best for you, but one must understand the tools they're using. What's the least you can do to be the most prepared?

Comments
Post a Comment